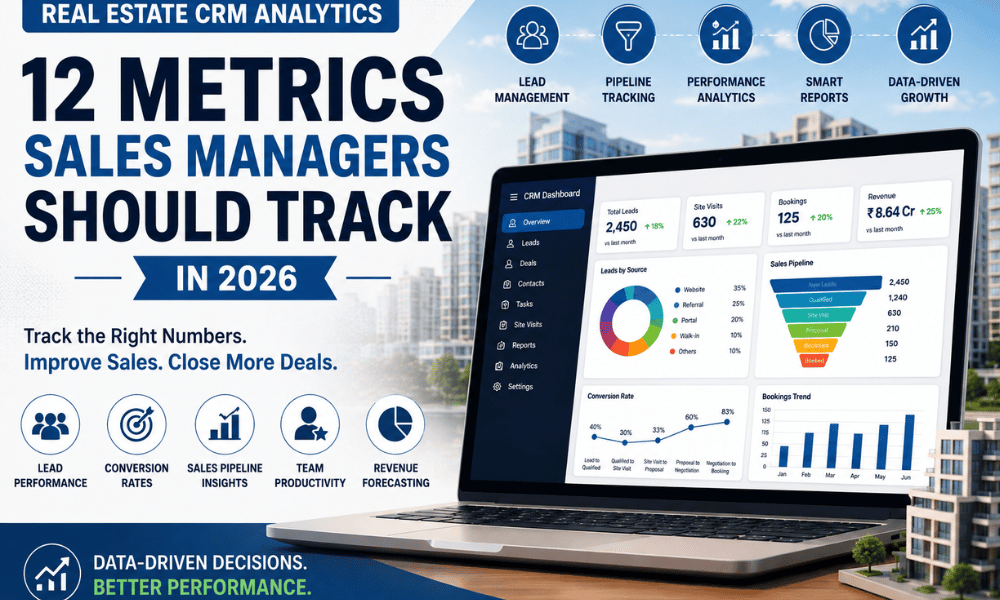
Real Estate CRM Analytics: 12 Metrics Sales Managers Should Track in 2026
Introduction
A real estate sales manager may have access to hundreds or even thousands of leads. The CRM dashboard may show calls, follow-ups, site visits, deals, bookings, and sales reports.
But having more data does not automatically mean making better decisions.
The real question is:
Which numbers actually help a sales manager improve performance?
For example, imagine your team generated 2,000 leads this month.
At first glance, that sounds like good news.
But what if:
- Only 1,000 leads were contacted?
- Only 400 were qualified?
- Only 150 attended a site visit?
- Only 20 resulted in bookings?
The problem is no longer lead generation alone. The CRM data can show exactly where prospects are dropping out of the sales process.
This is where real estate CRM analytics becomes valuable.
A well-organized CRM can help managers track the complete journey:
Lead → First Response → Qualification → Follow-Up → Site Visit → Negotiation → Booking
By measuring each stage, sales managers can identify bottlenecks, compare lead sources, understand team performance, and make better decisions based on actual sales data. Recent real-estate CRM analytics guidance similarly emphasizes tracking stage movement, source performance, response time, pipeline velocity, and booking outcomes rather than relying only on total lead counts.
In this guide, we will explore 12 important real estate CRM metrics that sales managers should track in 2026.
What Is Real Estate CRM Analytics?
Real estate CRM analytics is the process of analyzing sales, lead, customer, and pipeline data collected inside a CRM.
Instead of simply storing customer information, the CRM data is used to answer important business questions.
For example:
- Which marketing source generates the best leads?
- How quickly is the sales team contacting new enquiries?
- Which sales stage has the biggest drop-off?
- Which sales executive converts the most leads?
- How many site visits become bookings?
- Which projects are performing well?
- How long does it take to close a property sale?
The goal is not to track every possible number.
The goal is to track the numbers that help you take action.
A useful real estate CRM dashboard should help a sales manager answer:
What is working, what is not working, and what should the team do next?
Why Real Estate Sales Managers Need CRM Analytics
Real estate sales involves multiple people, channels, projects, and customer interactions.
Leads can come from:
- Google Ads
- Meta Ads
- Property portals
- Website enquiries
- Walk-ins
- Referrals
- Channel partners
Once a lead enters the system, several things can happen.
The prospect may answer immediately. Another may need five follow-ups. One customer may book a site visit within two days, while another may take several months to make a decision.
Without analytics, managers may only see the final result: booked or not booked.
With CRM analytics, they can understand the journey before that result.
This is important because leading indicators such as response time, stage conversion, and follow-up activity can reveal problems before they appear in monthly revenue reports.
1. Lead Response Time
Lead response time measures how long it takes for a sales representative to make the first contact after a new enquiry enters the CRM.
Formula
Total time taken for first responses ÷ Number of leads responded to
Example
If 100 leads receive their first response in a combined total of 1,000 minutes:
1,000 ÷ 100 = 10 minutes average response time
This metric matters because real estate buyers often contact multiple developers, real estate agents, or brokers at the same time.
If one company responds quickly and another responds hours later, the faster team usually has a better opportunity to begin the conversation.
Track response time by:
- Sales executive
- Lead source
- Project
- Day of the week
- Time of day
What sales managers should ask
- Which team members respond the fastest?
- Are leads waiting longer during weekends?
- Which lead sources are receiving slow responses?
- Are some leads never receiving a first contact?
Action tip: Set a clear response-time SLA inside the CRM and automatically flag overdue leads.
Recent industry guidance consistently treats response time as an important early-stage performance indicator, particularly when teams receive leads from multiple digital and portal sources.
2. Lead-to-Qualification Rate
Not every enquiry is ready to buy.
Some people may be researching. Others may have an unrealistic budget or be looking for a different property type.
The lead-to-qualification rate shows how many total leads become qualified opportunities.
Formula
Qualified Leads ÷ Total Leads × 100
Example
You receive 1,000 leads.
Out of those, 300 meet your qualification criteria.
300 ÷ 1,000 × 100 = 30%
The percentage itself is less important than understanding why it changes.
A sudden drop could indicate:
- Poor-quality advertising traffic
- Incorrect targeting
- Weak qualification questions
- Inventory mismatch
- A change in campaign messaging
Sales managers should compare this metric across lead sources instead of assuming every lead has the same value
Source-level qualification analysis is also a key way CRM data can reveal whether a funnel problem starts with acquisition quality or with the sales process.
3. Lead-to-Site-Visit Conversion Rate
For many real estate businesses, a site visit is an important step between initial interest and a serious buying decision.
This metric shows how effectively the sales team moves qualified prospects toward visiting a property.
Formula
Completed Site Visits ÷ Qualified Leads × 100
Example
If 300 leads are qualified and 90 complete a site visit:
90 ÷ 300 × 100 = 30%
If this number falls, investigate:
- Is the sales team properly explaining the property?
- Are customers receiving enough information before the visit?
- Are site visits being scheduled at convenient times?
- Are follow-ups happening after initial contact?
- Is the property matching the customer's requirements?
Don't only track total site visits.
Track the conversion rate by:
- Sales executive
- Project
- Lead source
- Property type
- Customer segment
This helps managers identify where the real problem exists.
4. Site Visit-to-Booking Conversion Rate
Generating a site visit is not the final goal.
A sales manager also needs to know how many visitors eventually become customers.
Formula
Number of Bookings ÷ Completed Site Visits × 100
Example
If 100 customers complete a site visit and 15 make a booking:
15 ÷ 100 × 100 = 15%
This metric can reveal whether your problem is at the top or bottom of the sales funnel.
For example:
- High lead-to-site-visit conversion + low booking conversion may indicate problems with pricing, inventory fit, sales presentation, financing, or post-visit follow-up.
- Low site visits + strong booking conversion may indicate that the team is losing prospects before they reach the property.
Recent 2026 real-estate analytics content particularly emphasizes connecting visit outcomes with subsequent bookings so teams can see which projects, lead sources, or salespeople convert visits most effectively.
5. Overall Lead-to-Booking Conversion Rate
This is one of the most important outcome metrics.
It shows how efficiently the complete sales funnel turns enquiries into bookings.
Formula
Total Bookings ÷ Total Leads × 100
Example
If you generate 2,000 leads and receive 40 bookings:
40 ÷ 2,000 × 100 = 2%
However, do not stop at this number.
Break it down by:
- Campaign
- Lead source
- Project
- Salesperson
- Location
- Property type
- Customer segment
For example:
| Lead Source | Leads | Bookings | Conversion |
| Google Ads | 500 | 15 | 3% |
| Meta Ads | 800 | 10 | 1.25% |
| Property Portal | 400 | 8 | 2% |
| Referrals | 300 | 7 | 2.33% |
This type of analysis is more useful than simply celebrating the channel that generated the highest number of leads.
The best source is not always the one that delivers the most enquiries.
It may be the one that delivers the most profitable bookings.
6. Conversion Rate by Lead Source
A real estate company may spend money across multiple channels, but every channel should not receive the same budget automatically.
CRM analytics can connect:
Lead Source → Sales Journey → Site Visit → Booking
This allows managers to identify which channels create actual business results.
Compare:
- Number of leads
- Qualification rate
- Site visits
- Bookings
- Revenue
- Marketing spend
This gives you a much clearer picture of lead quality.
For example, one campaign may generate 1,000 cheap leads but only five bookings.
Another campaign may generate 300 leads and produce 15 bookings.
The second campaign may have delivered greater business value.
Tracking funnel performance by acquisition source is increasingly central to real-estate sales analytics because headline lead volume alone does not reveal which channels actually contribute to downstream bookings.
7. Cost Per Booking
Cost per lead is useful.
But cost per booking can be more meaningful for management decisions.
Formula
Total Marketing Spend ÷ Number of Bookings
Example
Your company spends ₹5,00,000 on campaigns.
The campaigns generate 25 bookings.
₹5,00,000 ÷ 25 = ₹20,000 cost per booking
This helps marketing and sales teams look beyond lead quantity.
A campaign with a low cost per lead may still be expensive if those leads rarely convert.
A campaign with a higher cost per lead may be more profitable if it produces serious buyers.
Track this metric by:
- Campaign
- Channel
- Project
- Location
- Property segment
8. Sales Pipeline Velocity
Pipeline velocity measures how quickly leads move through your sales process.
A property sale may move through stages such as:
New Lead → Qualified → Site Visit → Negotiation → Booking
If prospects are spending longer than usual at a particular stage, the CRM can reveal a bottleneck.
Track:
- Average days from lead to qualification
- Average days to schedule a site visit
- Average days from site visit to negotiation
- Average days from negotiation to booking
Example
Suppose:
- Lead to qualification: 2 days
- Qualification to site visit: 7 days
- Site visit to negotiation: 10 days
- Negotiation to booking: 20 days
The total sales cycle is approximately 39 days.
Now imagine the negotiation stage suddenly increases from 20 days to 40 days.
That could indicate a problem with:
- Pricing
- Financing
- Inventory availability
- Documentation
- Customer objections
Pipeline stage timing is valuable because it can highlight bottlenecks before a deal is officially lost.
9. Follow-Up Completion Rate
A CRM is only valuable when the sales process is actually followed.
The follow-up completion rate shows whether scheduled customer activities are being completed.
Formula
Completed Follow-Ups ÷ Scheduled Follow-Ups × 100
Example
Your sales team has 500 follow-ups scheduled for the week.
400 are completed.
400 ÷ 500 × 100 = 80%
An 80% rate means that 20% of planned customer activities were missed or not completed.
Managers should investigate:
- Which salespeople have the highest number of overdue follow-ups?
- Are certain leads repeatedly ignored?
- Are teams creating too many unrealistic tasks?
- Are reminders and assignments working correctly?
This metric can help reduce lead leakage.
This metric can help reduce lead leakage.A CRM with thousands of leads but poor follow-up discipline is simply a larger database.
10. Sales Executive Performance
It is tempting to judge salespeople only by the number of bookings they close.
But bookings are a lagging metric.
A sales manager should also look at the activities and conversion stages that lead to those results.
Track each sales executive's:
- Leads assigned
- First response time
- Qualification rate
- Follow-ups completed
- Site visits scheduled
- Site visits completed
- Conversion rate
- Bookings
- Revenue generated
Example
| Sales Executive | Leads | Site Visits | Bookings |
| Executive A | 300 | 90 | 15 |
| Executive B | 300 | 60 | 14 |
| Executive C | 300 | 100 | 10 |
Executive C is generating the highest number of visits but the lowest number of bookings.
That information creates a useful coaching opportunity.
Perhaps the problem is:
- Qualification quality
- Property presentation
- Objection handling
- Follow-up after the visit
Analytics should help managers understand why performance differs—not simply rank employees.
11. Lead Aging and Stalled Opportunities
Every real estate CRM should help managers identify leads that have stopped progressing.
A lead may remain in the same stage for:
- 7 days
- 15 days
- 30 days
- 60 days
- 90+ days
The right time period will depend on your typical sales cycle.
Example
A dashboard might show:
| Lead Stage | Average Age |
| New Lead | 1 Day |
| Qualified | 5 Days |
| Site Visit | 12 Days |
| Negotiation | 28 Days |
If the negotiation stage keeps growing, the sales manager should investigate the cause.
Stalled leads are not always lost leads.
Some may simply require:
- A new follow-up
- A different property option
- Senior sales involvement
- A financing discussion
- A revised offer
CRM analytics helps teams find these opportunities before they disappear completely.
12. Sales Forecast and Pipeline Value
The final metric is about looking forward instead of only looking backward.
A sales manager should know:
What has already been booked?
But also:
What is likely to close next?
A CRM can help create a sales forecast based on:
- Active opportunities
- Deal value
- Pipeline stage
- Expected closing date
- Historical conversion patterns
- Sales probability
Example
| Opportunity | Property Value | Probability | Weighted Forecast |
| Lead A | ₹80 lakh | 20% | ₹16 lakh |
| Lead B | ₹1 crore | 50% | ₹50 lakh |
| Lead C | ₹75 lakh | 80% | ₹60 lakh |
Total weighted pipeline value: ₹1.26 crore
This is not a guaranteed revenue figure.
It is an estimate that helps management understand the strength of the active sales pipeline.
Real-time pipeline visibility and forward-looking forecasting are increasingly highlighted as key uses of connected CRM data, especially when historical results alone are insufficient for managing upcoming sales targets.
The 12 Real Estate CRM Metrics at a Glance
| Metric | What It Tells You |
| 1. Lead Response Time | How quickly your team contacts new leads |
| Lead B | ₹1 crore |
| 2. Lead-to-Qualification Rate | How many enquiries become serious opportunities |
| 3. Lead-to-Site-Visit Conversion | How effectively leads move toward a property visit |
| 4. Site Visit-to-Booking Conversion | How well visits convert into bookings |
| 5. Overall Lead-to-Booking Rate | Total sales funnel efficiency |
| 6. Conversion by Lead Source | Which channels generate valuable customers |
| 7. Cost Per Booking | How much it costs to acquire a booking |
| 8. Pipeline Velocity | How quickly deals move through the sales funnel |
| 9. Follow-Up Completion Rate | Whether customer activities are being completed |
| 10. Sales Executive Performance | Individual team performance and coaching needs |
| 11. Lead Aging | Which opportunities are becoming inactive |
| 12. Sales Forecast | Expected future revenue based on the pipeline |
How Often Should Sales Managers Review These Metrics?
You don't need to review every number every hour.
A simple schedule can work better.
Daily
Review:
- New leads
- Response time
- Overdue follow-ups
- Uncontacted leads
- Site visits scheduled
Weekly
Review:
- Conversion by sales stage
- Sales executive performance
- Lead source performance
- Site visit conversion
- Stalled leads
Review:
- Overall bookings
- Lead-to-booking conversion
- Cost per booking
- Revenue by source
- Project performance
- Pipeline forecast
The goal is to create a regular review process rather than looking at CRM reports only when sales numbers fall.
Common Mistakes in Real Estate CRM Analytics
Tracking Too Many Metrics
A dashboard with 50 numbers can create confusion.
Start with the metrics that influence real decisions.
Measuring Only Lead Volume
More leads do not always mean more revenue.
Always connect lead volume with quality and conversion.
Looking Only at Monthly Bookings
Bookings show what happened.
Response time, follow-ups, and stage conversion can show problems before bookings decline.
Comparing Salespeople Without Context
One salesperson may receive better-quality leads than another.
Compare performance using multiple metrics
Ignoring Stalled Leads
A lead sitting in the same stage for weeks may represent a lost opportunity—or an opportunity that needs attention.
Using CRM Data Without Taking Action
Analytics should lead to decisions.
For example:
Problem: Meta Ads produce many leads but few site visits.
Action: Review campaign targeting and lead qualification.
Problem: One sales executive has slow response times.
Action: Review workload or provide coaching.
Problem: Site visits are high but bookings are low.
Action: Analyze property fit, sales presentation, pricing objections, and post-visit follow-up.
This is the real value of CRM analytics.
How to Build a Better Real Estate CRM Dashboard
A good dashboard should not try to show everything.
Start with four areas.
1. Lead Health
- New leads
- Response time
- Uncontacted leads
- Qualified leads
2. Funnel Performance
- Qualification rate
- Site visit conversion
- Booking conversion
- Stage drop-off
3. Team Performance
- Leads assigned
- Follow-ups completed
- Site visits
- Bookings
- Conversion rate
4. Revenue and Forecasting
- Bookings
- Booking value
- Cost per booking
- Pipeline value
- Expected revenue
This structure gives sales managers a clear overview without overwhelming them with unnecessary reports
How TranquilCRM Can Help Turn Sales Data Into Action
For a real estate sales team, CRM analytics should not be limited to charts.
The purpose of analytics is to improve the next decision.
For example, a sales manager should be able to identify:
- Leads that need immediate attention
- Campaigns producing better-quality prospects
- Sales stages with the highest drop-off
- Team members who need coaching
- Projects with strong or weak sales movement
- Opportunities that are close to booking
A real estate-focused CRM such as TranquilCRM can help bring lead, customer, follow-up, sales activity, and pipeline information into a more organized workflow.
The real advantage comes when teams consistently update CRM data and managers use that information to improve response times, follow-ups, and conversion processes.
Frequently Asked Questions
What is real estate CRM analytics?
Real estate CRM analytics is the process of analyzing CRM data to understand lead performance, sales activity, conversion rates, site visits, bookings, team performance, and future sales opportunities.
What metrics should a real estate sales manager track?
Important metrics include lead response time, qualification rate, lead-to-site-visit conversion, site-visit-to-booking conversion, lead source performance, cost per booking, pipeline velocity, follow-up completion, sales performance, lead aging, and sales forecasts.
What is the most important CRM metric for real estate?
There is no single metric for every business. However, response time, conversion by sales stage, site-visit-to-booking conversion, and cost per booking are particularly useful because they connect daily sales activity with business outcomes.
How do you calculate lead-to-booking conversion?
Use this formula:
Total Bookings ÷ Total Leads × 100
For example, 20 bookings from 1,000 leads equals a 2% lead-to-booking conversion rate.
Why is lead source tracking important in real estate?
Lead source tracking helps businesses understand which marketing channels generate not just enquiries, but qualified leads, site visits, bookings, and revenue.
What is pipeline velocity in real estate?
Pipeline velocity measures how quickly leads move through the sales process. Tracking the time spent in each stage can help managers identify bottlenecks.
How can CRM analytics improve sales performance?
CRM analytics can identify slow response times, missed follow-ups, weak conversion stages, underperforming campaigns, stalled leads, and coaching opportunities. Managers can then take action based on data instead of assumptions.
How often should a sales manager review CRM analytics?
Operational metrics such as new leads and overdue follow-ups can be reviewed daily. Conversion and team performance can be reviewed weekly, while revenue, cost, and forecasting metrics are often useful for monthly reviews.
Final Thoughts
The best real estate CRM Software dashboard is not the one with the most charts.
It is the one that helps a sales manager answer:
Where are we losing leads?
Which marketing channels are producing actual bookings?
Which sales activities need improvement?
What opportunities are currently at risk?
What is likely to close next?
By tracking these 12 real estate CRM metrics, sales managers can move beyond guesswork and develop a clearer understanding of the entire property sales journey.
In 2026, successful real estate teams should not simply collect more data.
They should focus on turning the data they already have into faster decisions, better follow-ups, stronger sales performance, and improved customer conversion.